Corixa Pulse is a macOS menu-bar dashboard that gives Claude Code users a real-time window into their usage: conversations, token counts, session history, and project activity. With version 1.1, we are shifting the focus to one question every subscriber asks sooner or later: is my Claude plan actually worth it?
The v1.1 update introduces a full Cost & Tokens analytics section, per-model breakdowns, cache efficiency metrics, plan utilization tracking, and flexible period filtering. Together, these features turn raw JSONL logs into a clear picture of the value your subscription delivers.
Cost & Token Analytics
The centerpiece of v1.1 is the new Cost & Tokens section. It answers a deceptively simple question: what would you pay for the same usage at API rates?
Corixa Pulse reads your Claude Code session logs, tallies every input and output token, applies current Anthropic API pricing, and presents a single API-equivalent value figure. If you are on the Pro plan at $20/month and Pulse shows $340 in API-equivalent usage for the same period, your effective ROI is immediately obvious.
Alongside the dollar figure you will find:
- Total output tokens — the tokens Claude generated for you.
- Total input tokens — the context you sent, including file contents, conversation history, and system prompts.
- Cache hit rate — the percentage of input tokens served from cache rather than re-processed.
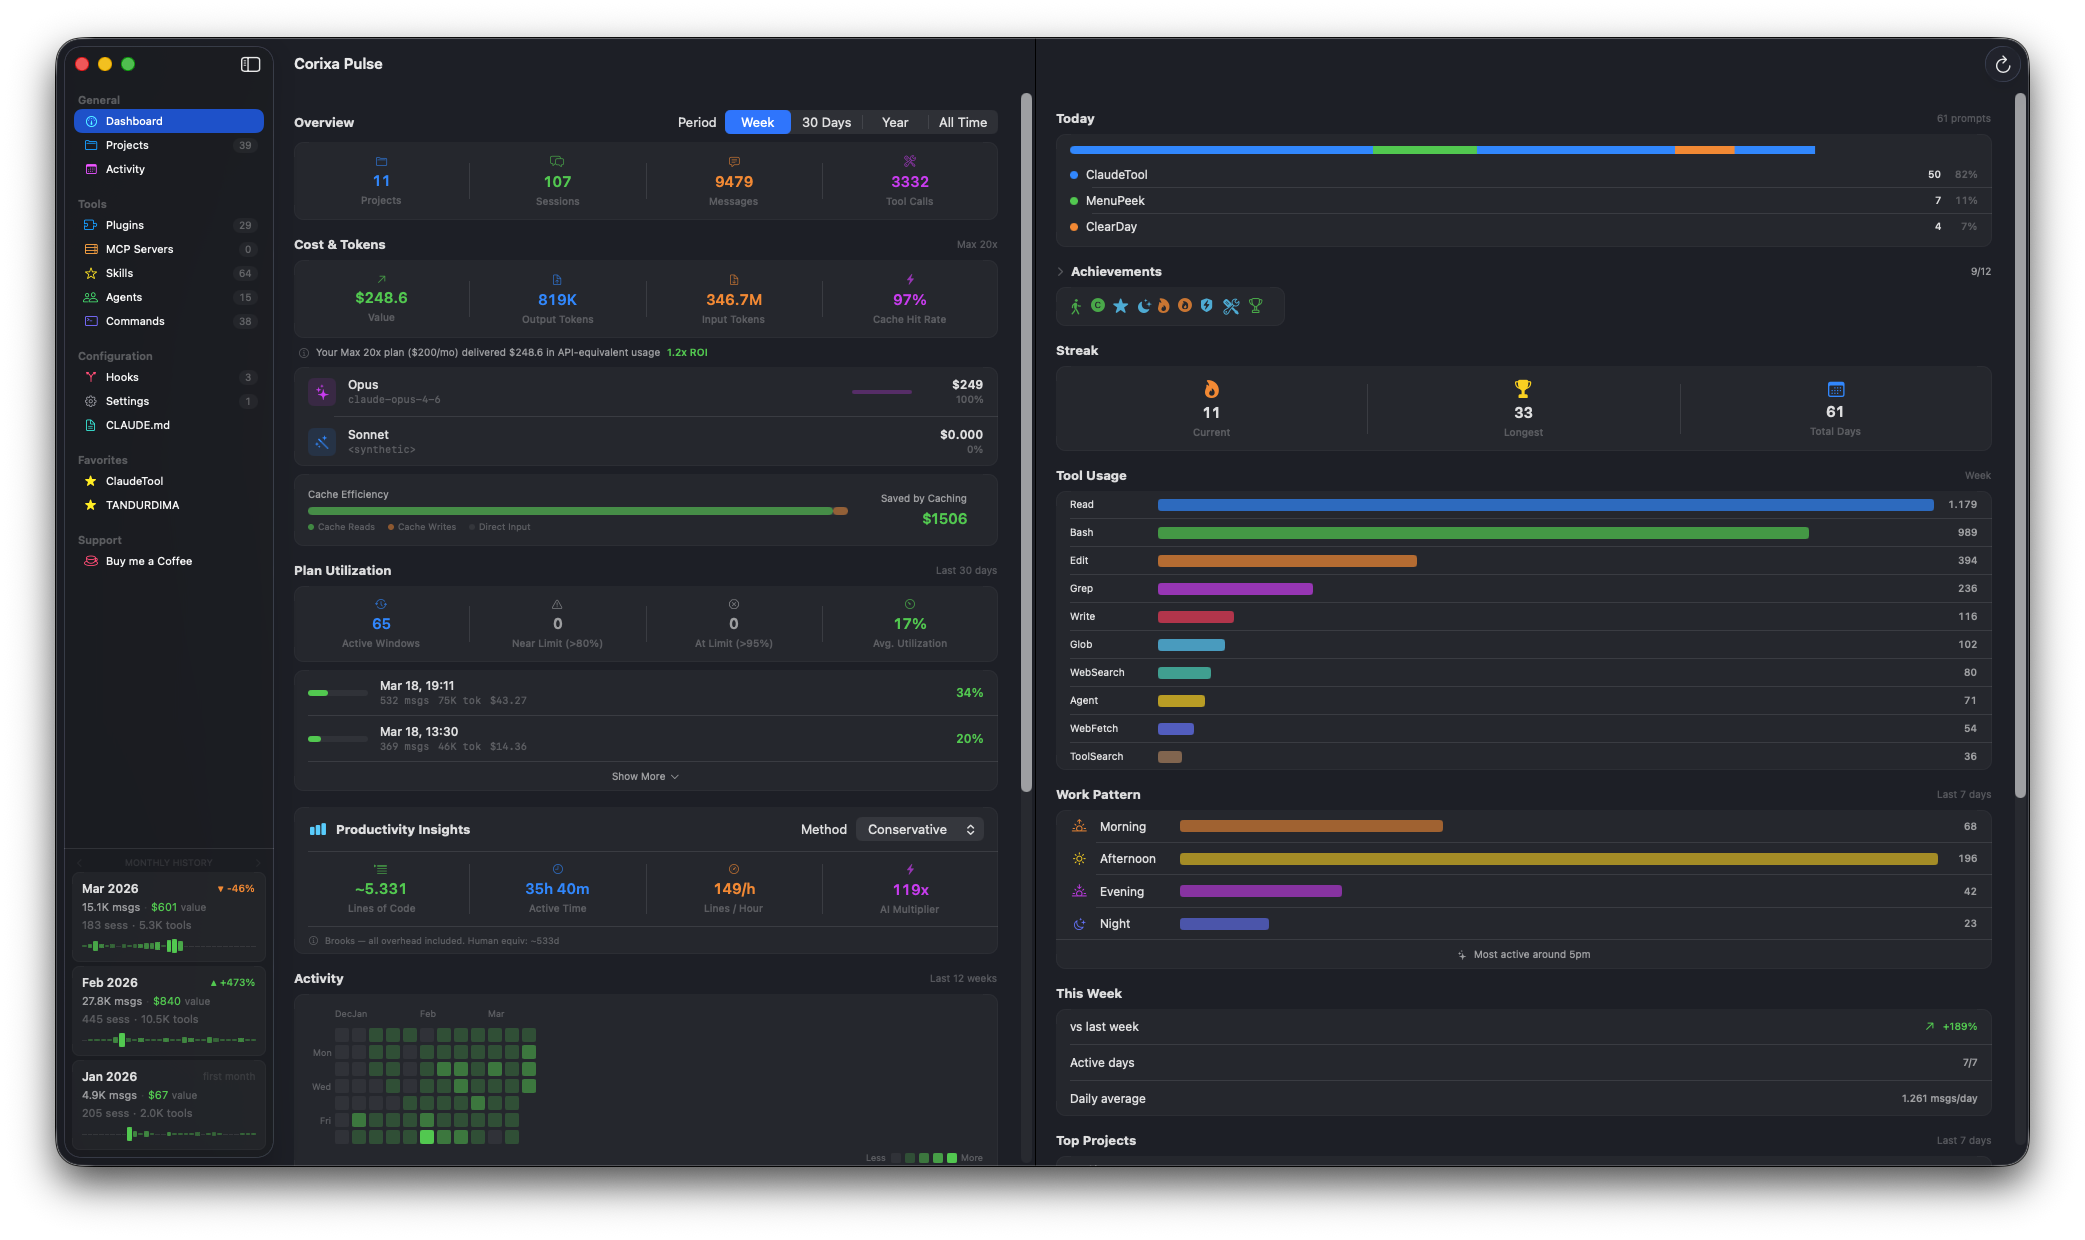
What is API-equivalent value? Anthropic publishes per-token prices for each model tier (Opus, Sonnet, Haiku). Corixa Pulse multiplies your actual token counts by those rates and sums the result. The total represents what you would have spent if you had paid for the same work through the API instead of using your subscription. It is the clearest measure of how much value your flat-rate plan delivers.
Per-Model Breakdown
Not all tokens are created equal. An Opus token costs significantly more at API rates than a Haiku token, and knowing which models you actually use matters for understanding your subscription's value.
The new model breakdown view shows:
- Cost distribution across Opus, Sonnet, and Haiku, expressed in both dollars and percentages.
- Proportion bars that make it easy to see at a glance where your usage concentrates.
- Percentage splits so you can track how your model mix shifts over time.
If you find that 90% of your API-equivalent value comes from Opus, that is a strong signal that your subscription is paying for itself many times over. Conversely, if most of your work uses Haiku, you might reconsider whether a lower-tier plan would suffice.
Cache Efficiency
Caching is one of the most impactful optimizations in the Claude API, and Claude Code uses it aggressively. When the same context (file contents, system prompts, conversation history) is sent across multiple requests, cached tokens are processed faster and cost less at API rates.
Corixa Pulse v1.1 adds a stacked efficiency bar that breaks your input tokens into three categories:
- Cache reads — tokens served from an existing cache entry. These are the cheapest and fastest.
- Cache writes — tokens processed for the first time and written to cache for future reuse.
- Direct input — tokens that bypassed caching entirely.
Below the bar, Pulse shows an estimated dollar savings from caching: the difference between what your usage would have cost at full input token rates versus what it cost with cache discounts applied.
High cache read ratios mean Claude Code is efficiently reusing context across your conversations. If your cache efficiency is low, it may indicate short, isolated conversations where context is rarely reused, which is useful information for adjusting your workflow.
Plan Utilization
Claude subscription plans impose usage limits within rolling 5-hour windows. If you hit the limit, you are throttled until the window resets. Corixa Pulse now tracks your utilization history over the last 30 days so you can see patterns you might otherwise miss.
The utilization view includes:
- Color-coded bars for each 5-hour window, ranging from green (light usage) through yellow and orange to red (at or near the limit).
- Active windows count — the total number of 5-hour periods where you had any Claude Code activity.
- Near-limit count — how many windows approached the plan ceiling.
- At-limit count — how many windows hit the cap, triggering throttling.
If you are frequently hitting limits, it may be time to upgrade your plan. If you rarely exceed 50% utilization, your current plan has headroom to spare. Either way, you are making the decision with data rather than guesswork.
Plan Selector
Different Claude plans have different usage limits, and Pulse needs to know which plan you are on to calculate utilization accurately. On first launch after the update, Corixa Pulse prompts you to select your plan:
- Pro — the standard Claude subscription.
- Max 5x — five times the Pro usage limits.
- Max 20x — twenty times the Pro usage limits.
Once selected, all utilization metrics, threshold colors, and near-limit calculations are calibrated to your actual plan. You can change your plan selection at any time from the settings.
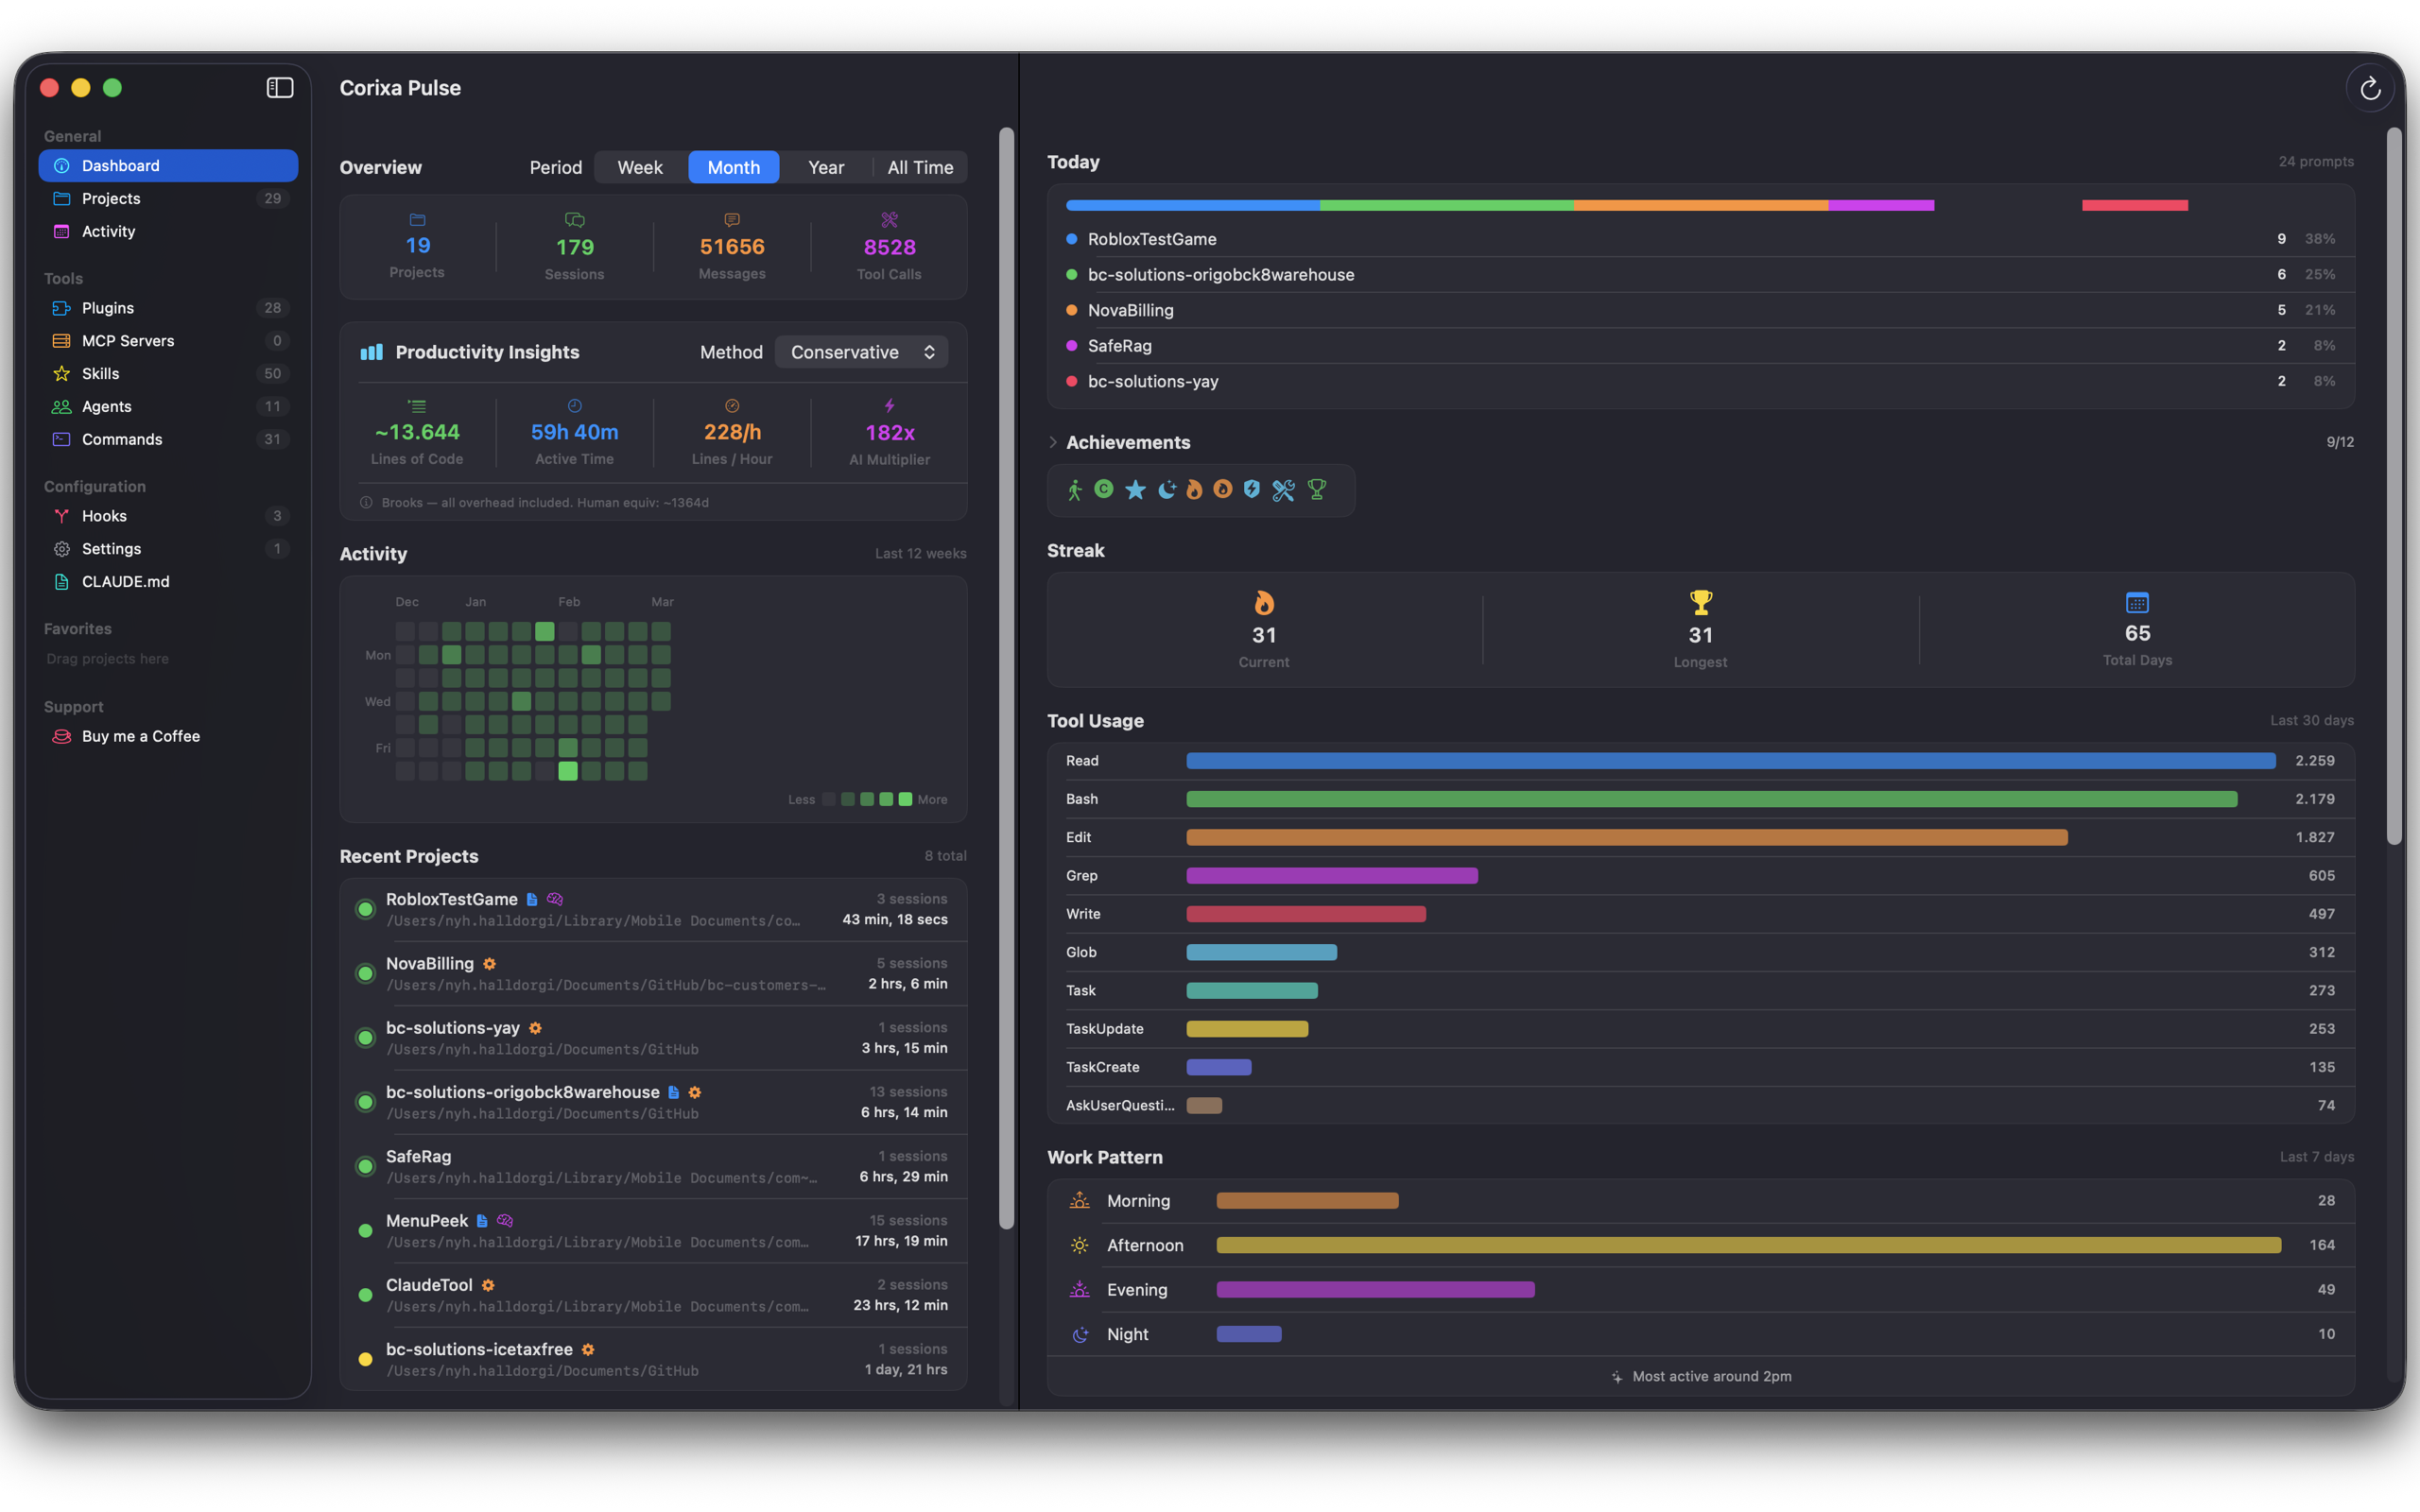
Period Filtering
Usage patterns look very different depending on the time horizon. A busy week does not necessarily mean a busy month, and year-over-year trends reveal habits that weekly snapshots cannot.
Corixa Pulse v1.1 adds a period selector that lets you switch between:
- Week — the last 7 days.
- 30 Days — the last month of activity.
- Year — the last 12 months.
- All Time — every session Pulse has ever tracked.
The period filter applies to cost totals, token counts, and model breakdown charts, so you can compare your March usage against your January usage, or see how your API-equivalent value has grown since you started using Claude Code.
Open Projects in Your Editor
While the analytics features are the headline of v1.1, we also added a quality-of-life improvement for daily workflow. Right-click any project in the Corixa Pulse project list and you can:
- Open in your editor — launch the project directly in Cursor, VS Code, Windsurf, or Warp.
- Open CLAUDE.md — jump straight to the project's Claude instructions file.
- Open MEMORY.md — access the project's persistent memory file.
This turns Corixa Pulse into a lightweight project launcher alongside its monitoring role. See which project you worked on most this week, then open it in one click.
Getting Started
Corixa Pulse 1.1 is available now on the Mac App Store as a free update for existing users. If you are new to Corixa Pulse, you can download it and start tracking your Claude Code usage immediately. The app reads your existing Claude Code session logs, so historical data is available from the moment you launch.
Select your plan, choose a time period, and let the numbers speak for themselves. For most subscribers, the API-equivalent value alone makes the case that their Claude plan is one of the best deals in developer tooling.
Download Corixa Pulse from the Mac App Store or learn more on the product page.