Dashboard
The dashboard is your central hub for understanding Claude Code usage. It aggregates sessions, costs, tokens, and productivity metrics into a single view.
Overview Stats
The top of the dashboard displays four key metrics for the selected time period:
- Projects — number of distinct projects with Claude Code activity
- Sessions — total conversation sessions started
- Messages — total messages exchanged (user + assistant)
- Tool Calls — total tool invocations (file reads, edits, bash commands, etc.)
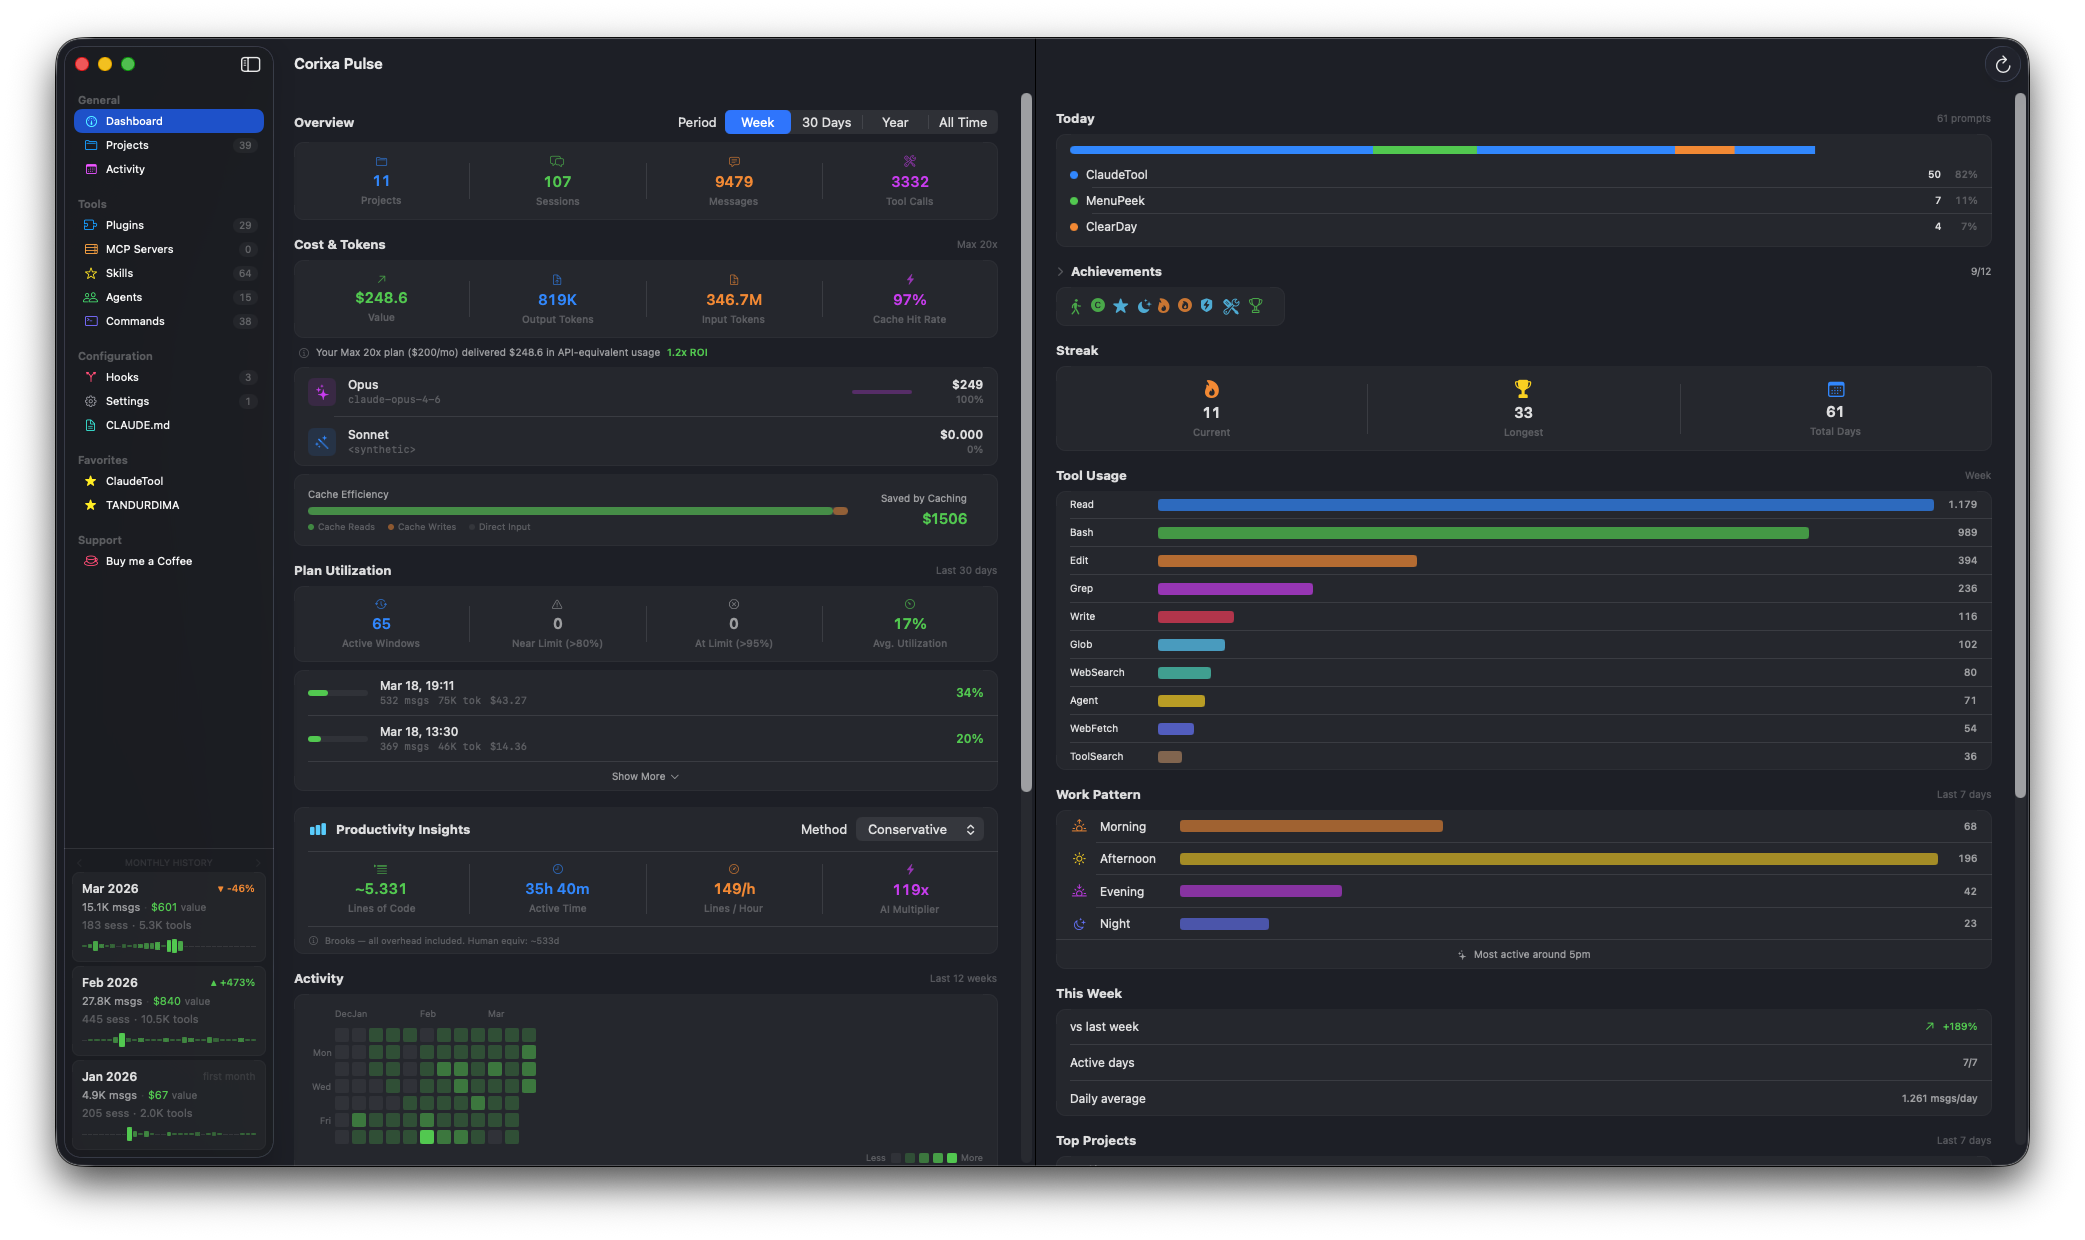
The dashboard with overview stats, cost analytics, and monthly history cards
Period Filtering
Use the period selector to filter all dashboard data by time range:
| Period | Description |
|---|---|
| Week | Last 7 days of activity |
| 30 Days | Last 30 days of activity |
| Year | Last 365 days (includes historical data if available) |
| All Time | Everything since your first session (includes historical data) |
Cost & Token Analytics
This section shows the API-equivalent value of your Claude Code usage:
- API-Equivalent Value — what your usage would cost at standard API rates
- ROI — the return on investment relative to your subscription cost
- Output Tokens — total tokens generated by Claude
- Input Tokens — total tokens sent to Claude (including context)
- Cache Hit Rate — percentage of input tokens served from cache
Per-Model Breakdown
See how your usage is distributed across different Claude models:
- Opus — the most capable model, used for complex reasoning tasks
- Sonnet — balanced model for everyday coding tasks
- Haiku — fast, lightweight model for simple operations
The breakdown shows message count and token usage per model, helping you understand which models are doing most of the work.
Full dashboard with model breakdown, tool usage, achievements, and work patterns
Cache Efficiency
The cache efficiency widget visualizes how effectively prompt caching is being utilized:
- Stacked bar chart — shows cache hits vs. uncached input tokens over time
- Savings estimate — estimated cost savings from prompt caching
- Cache hit rate trend — whether your caching efficiency is improving or declining
Plan Utilization
Track how much of your Claude subscription you're actually using. This widget is based on Anthropic's 5-hour rolling window system.
How It Works
- 5-hour windows — each bar represents a 5-hour rolling window of usage
- Color-coded bars — green for normal usage, yellow for approaching the limit, red for at-limit
- Near-limit count — how many times you've approached your plan's usage ceiling
- At-limit count — how many times you've hit the limit and had to wait
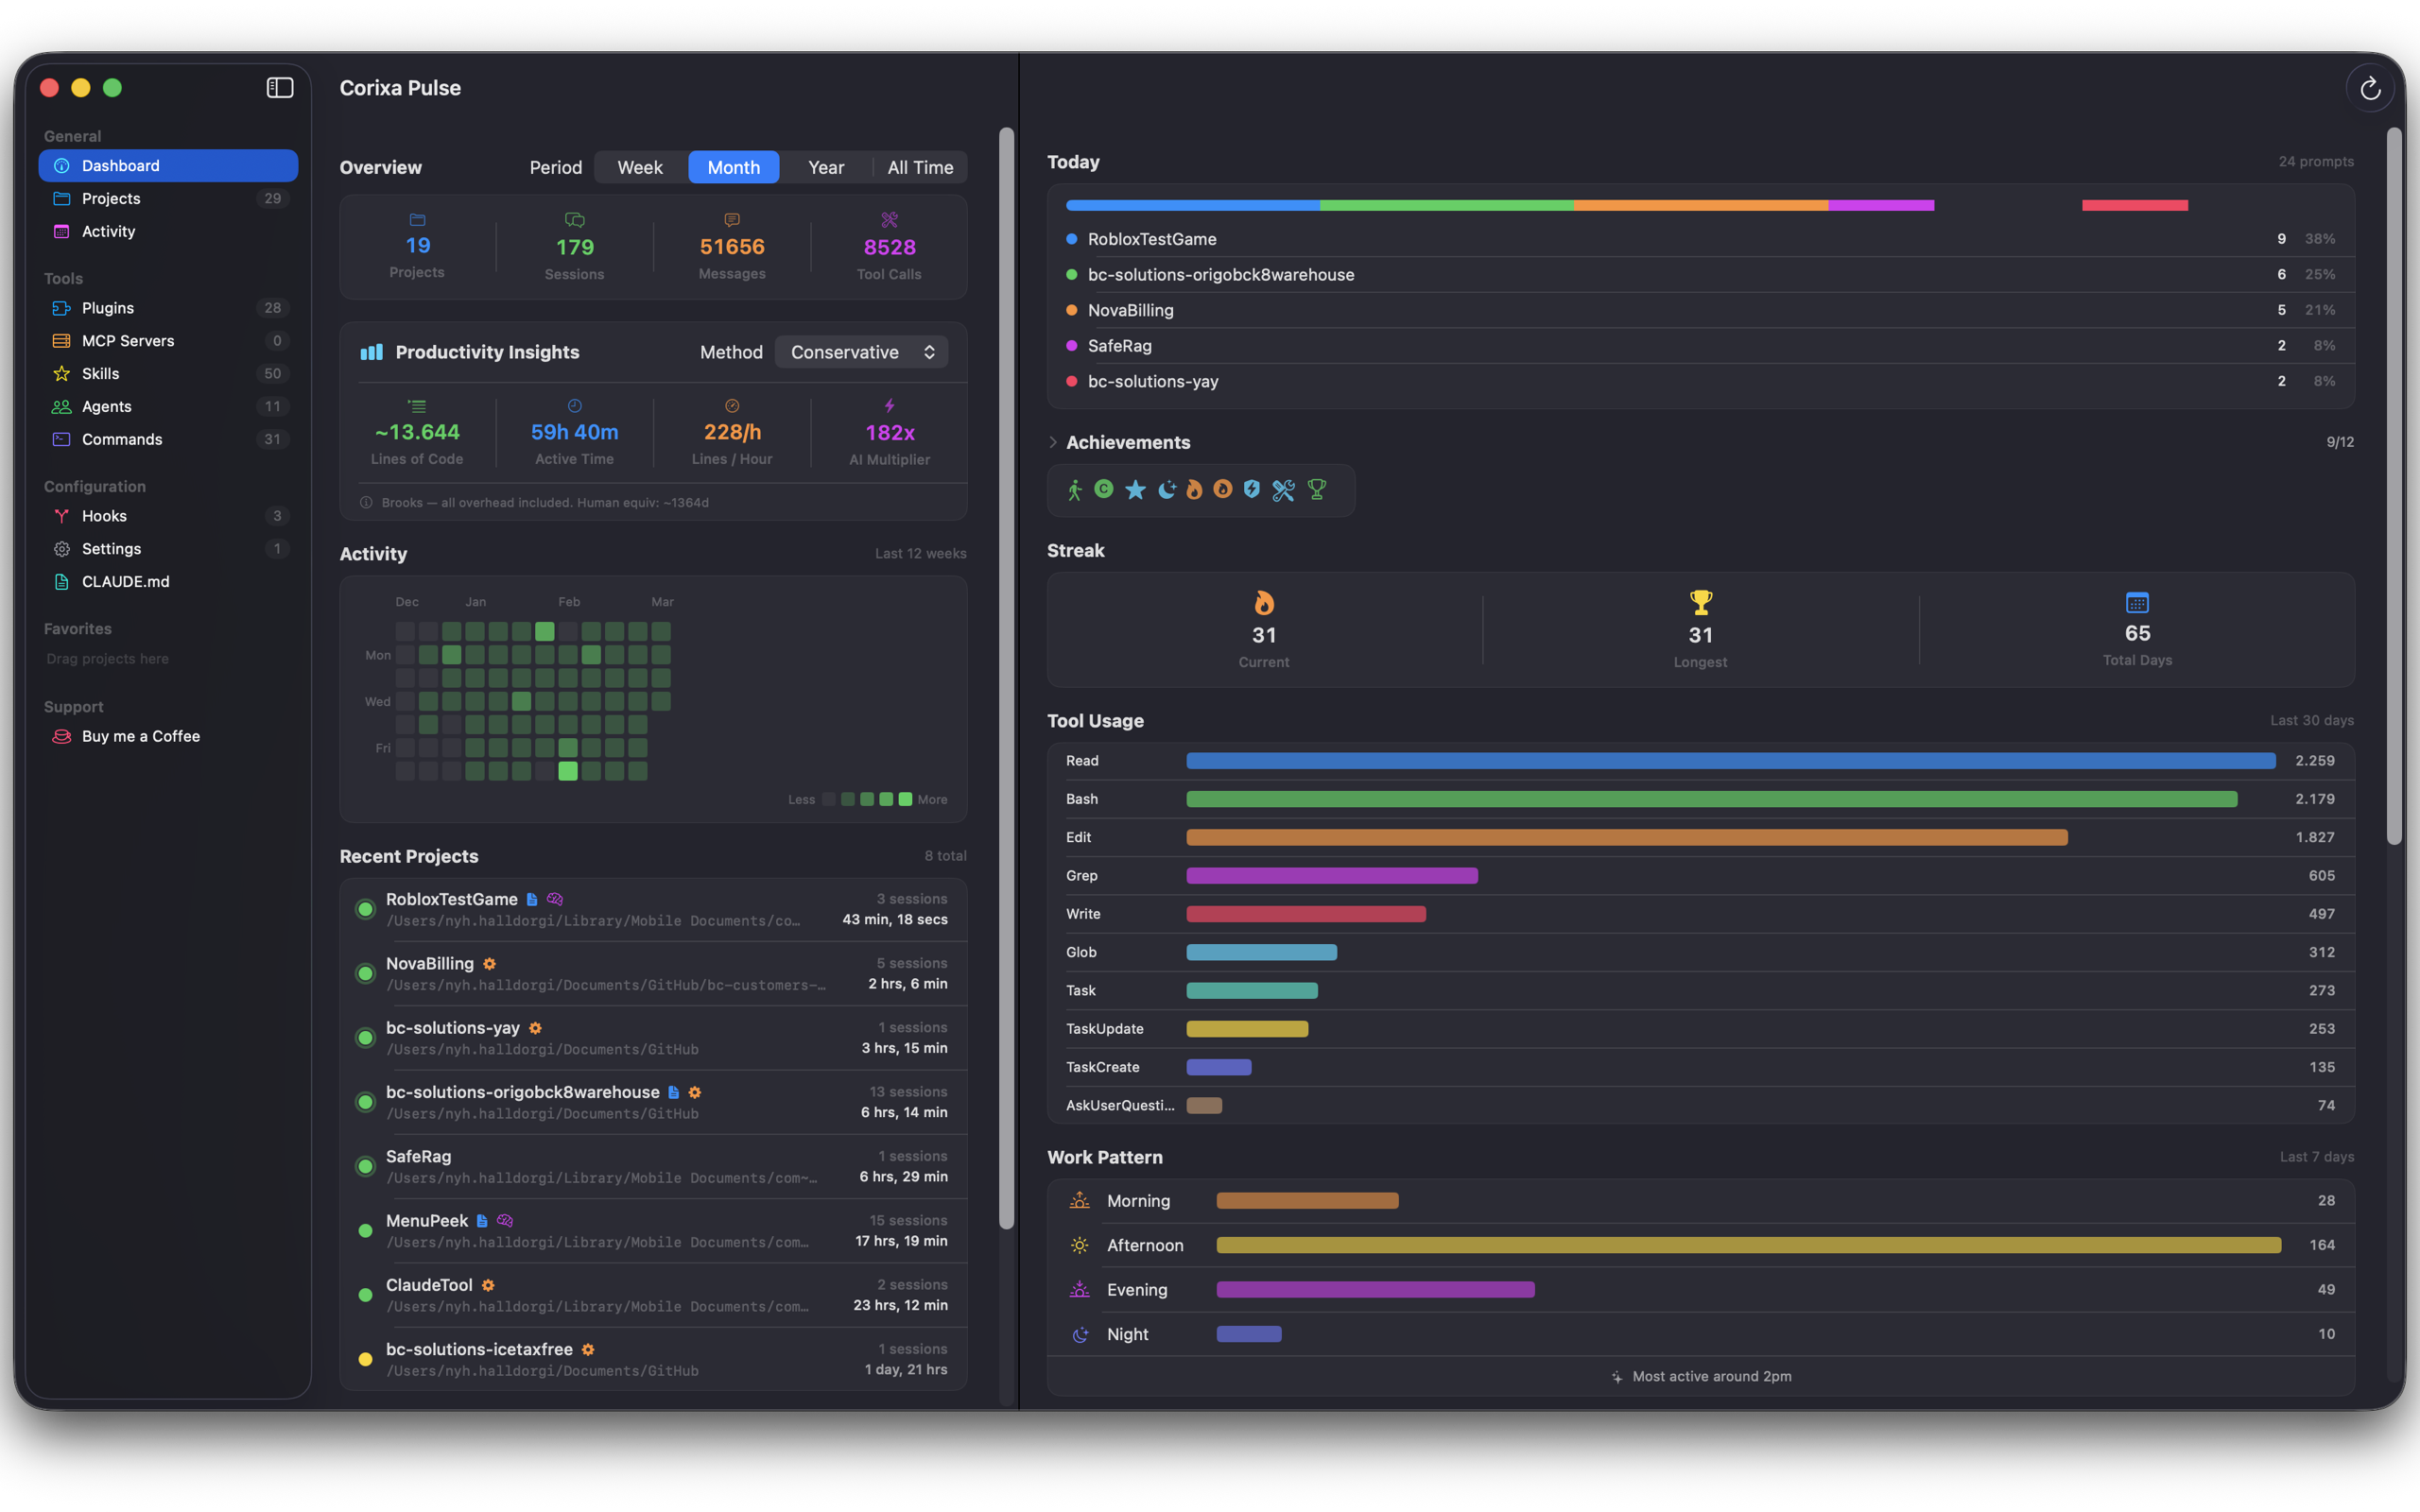
Productivity Insights
Get a sense of your coding productivity with estimated metrics:
- Estimated Lines of Code — approximate lines written or modified with Claude's help
- Active Time — estimated hours spent actively working with Claude Code
- AI Multiplier — an estimate of how much faster you're working compared to manual coding
Activity Heatmap
A GitHub-style contribution grid showing your Claude Code activity over the last 12 weeks. Each cell represents a day, with darker shading indicating more activity. Hover over any cell to see the exact session and message counts for that day.
Monthly History Cards
The sidebar displays monthly summary cards with key metrics:
- Total messages, cost, sessions, and tool calls for each month
- Sparkline graphs showing daily trends within the month
- Percentage change compared to the previous month
These cards are powered by Corixa Pulse's historical statistics system, so they persist even after Anthropic's 30-day data retention expires.
Monthly history cards visible in the right sidebar