Activity
The Activity view gives you a day-by-day breakdown of your Claude Code usage, with per-project timelines, productivity insights, and weekly trends.
Daily Activity View
The main Activity view shows your Claude Code usage for a single day. Use the date navigation controls to move between days:
- Previous / Next arrows — step one day at a time
- Today button — jump back to the current day
- Date picker — jump to a specific date
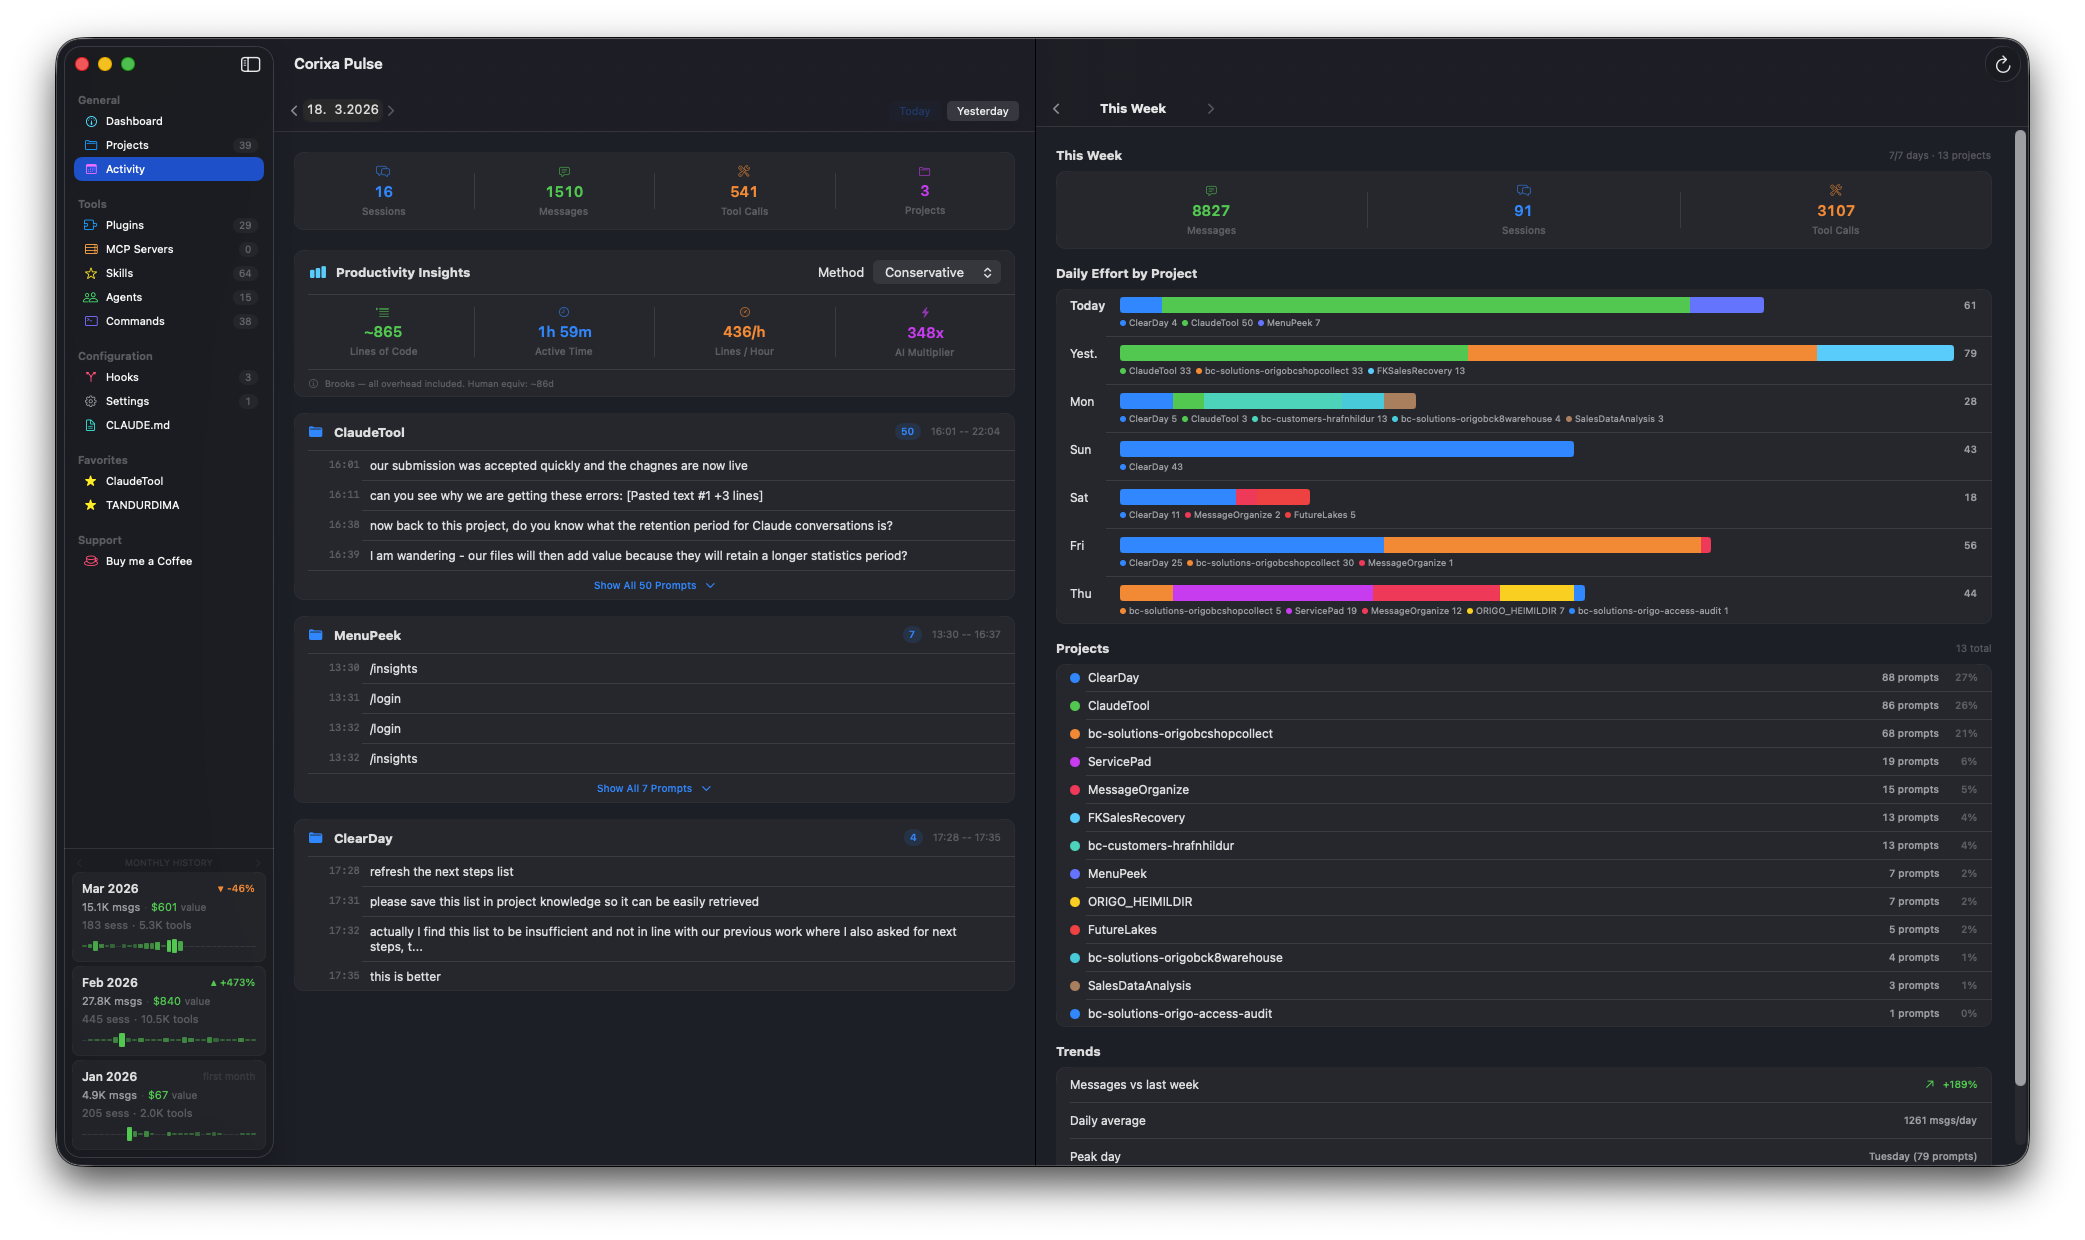
The Activity view with daily breakdown and weekly effort chart
Per-Project Activity
Activity for the selected day is grouped by project. For each project you'll see:
- Project name and directory path
- Prompt timeline — a chronological list of your prompts and Claude's responses throughout the day
- Session boundaries — visual separators between distinct sessions
- Message counts — how many messages were exchanged per project
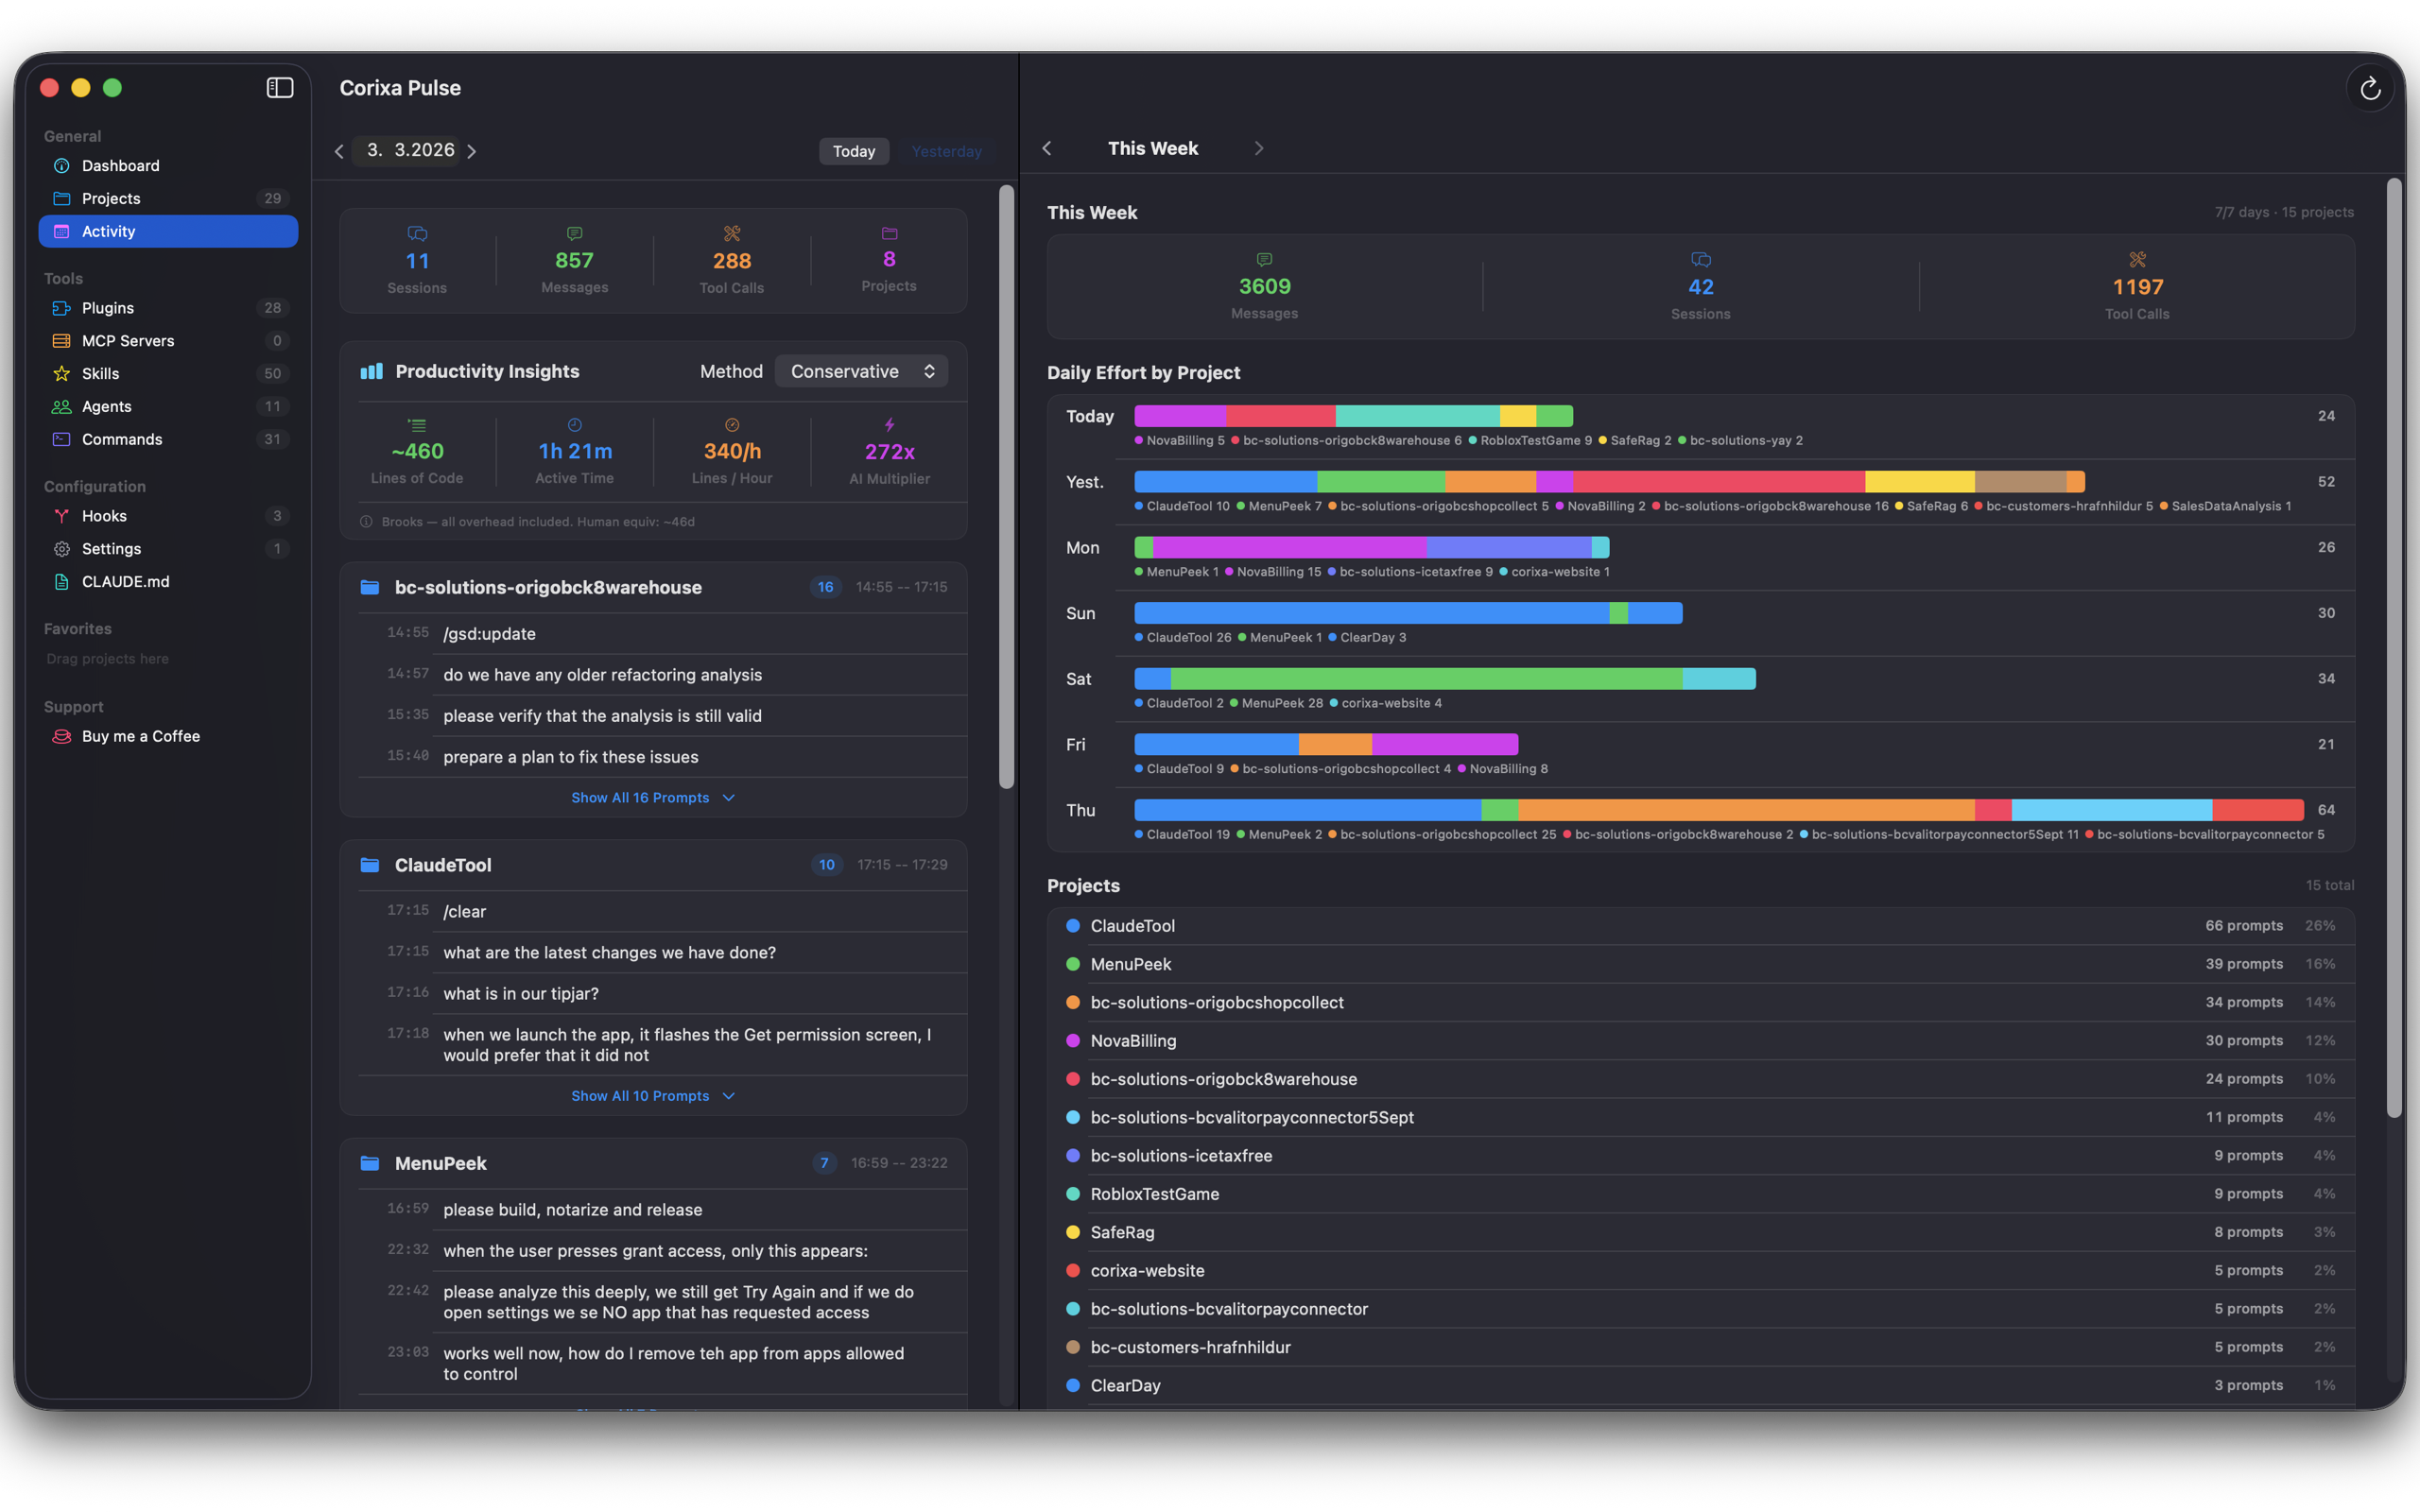
Daily activity grouped by project with prompt timelines
Productivity Insights Card
Each day includes a productivity insights card summarizing your output:
| Metric | Description |
|---|---|
| Lines of Code | Estimated lines written or modified with Claude's assistance |
| Active Time | Estimated hours spent actively working with Claude Code |
| AI Multiplier | Estimated productivity multiplier compared to manual coding |
Weekly Overview
The weekly overview shows a 7-day summary with stacked project bars:
- Stacked bars — each day is a bar segmented by project, with color-coding per project
- Bar height — represents relative activity level (messages or sessions)
- Click to navigate — click any day's bar to jump to that day's detail view
Project Legend & Daily Breakdown
Below the weekly chart, a legend maps colors to project names. The daily breakdown table shows:
- Each project that had activity on the selected day
- Number of sessions and messages per project
- Percentage of the day's total activity
Trends
The Activity view also surfaces trends to help you understand your usage patterns:
Messages vs Last Week
Percentage change in total messages compared to the same day last week.
Daily Average
Your average daily message count over the past 7 days.
Peak Day
Which day of the current week had the highest activity.